 The Social Science Research Network states that more than 65% of the world’s population are visual learners. Our Geographic Information Systems (GIS) team caters to this learning style and provides tools and methods for each of our market groups to share with clients. GIS not only allows one to visualize, analyze and interpret spatial data in innovative ways, but also provides ways to solve problems and answer questions. GIS contributes to efficiency and cost savings for many of our client’s projects.
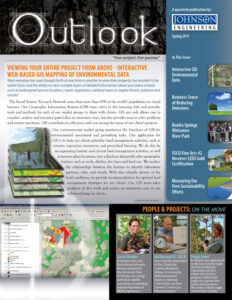
Our environmental market group maximizes the functions of GIS for environmental assessment and permitting tasks. One application for GIS is to help our clients prioritize land management activities, such as invasive vegetation treatments and prescribed burning. We do this by incorporating historic and current land management activities, as well as invasive plant locations, into a database along with other geographic features such as trails, ditches, fire lines and land use. We analyze the relationships between the features to identify infestation patterns, risks, and trends. With this valuable picture of the land conditions, we provide recommendations for optimal land management strategies for our clients. Our GIS team takes products of this work and creates an interactive easy to use web-based map for clients.
Our ecologists also use interactive databases in GIS to efficiently address our client’s permitting, mitigation, reporting and compliance needs. GIS technology allows our teams to combine publicly available data, like aerial photographs and topography, with data we have collected in the field, such as the location of wetlands, endangered species or exotic vegetation. We then apply this technology to assess cumulative impacts, species habitat, and territory modeling.
Various GIS assessments are often used during the Environmental Resource Permit (ERP) process to meet the requirements of Florida’s water management districts for both development and mitigation activities. In some cases the ERP permitting process entails evaluating the cumulative effects certain types of development or mitigation may have on wetlands, and the threatened and endangered animals that depend on them, such as the Florida panther, woodstorks and black bear. We have used GIS tools to develop methods for quantifying cumulative impacts on wetland function which includes consideration of all the various wetland factors from hydrology to wildlife. In one recent assessment, our team combined over fifteen different data sources to determine unique wetland functional values for more than 500,000 acres of land. Our water resources team also uses GIS technology to develop surface roughness for hydraulic modeling from FLUCCS mapping in watershed studies. This has greatly reduced the cost to determine roughness in modeling large areas such as the one mentioned above.
GIS technology is also an essential tool for creating habitat and territory models to identify probable nesting locations of protected animals, such as the Crested Caracara. By mapping flight patterns and observing the Caracara’s activities throughout nesting season, we are able to efficiently focus our survey efforts. When this mapped flight data is combined with ecosystem functionality data and species biology information, our mapping model becomes an important tool that increases effectiveness and efficiency of surveys, which translates to cost savings for our clients.
GIS is a technology that helps us do our jobs more efficiently and accurately. We also strive to find ways to accomplish more with smaller budgets, and GIS is a tool that has delivered success to our clients for a wide range of environmental aspects of their projects.


